Voronoi Diagram Rendering
Description
- RIT Grad Project, Fall 2012
- A follow-up to the terrain generation renderer
- Looked into using Voronoi Diagrams for interesting terrain generation
- largely based on the work by Amit Patel: polygon map generation
The previous terrain project was focused on rendering, so this follow-up project was supposed to be an exploration of using that rendering with my own terrain generation algorithm. Amit Patel (@redblobgames), wrote a wonderful article in 2010 called, “Polygonal Map Generation for Games” (linked above) which is about creating an island or terrain piece with different terrain details sub-divided into n-sided non-uniform polygons. This idea seemed particularly fascinating to me because it used a Voronoi Diagram to algorithmically subdivide a 2D array of random dots, into a somewhat organic shape. Many organic structures physically represent the Voronoi Diagram in nature, which I learned about when researching L-Systems.
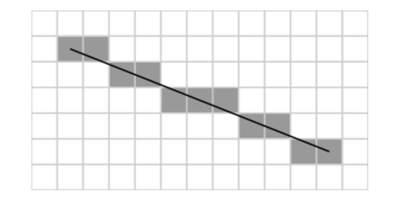
Creating a Voronoi diagram from a set of points is a fairly non-trivial algorithm. There’s a lot of implementations out there, and it was never a goal of this project to re-create one of those algorithms, unfortunately I can’t find the reference to the library I used at the time of this project (or any of the source code for that matter). What most Voronoi libraries produced were an array of line segments that made up the diagram given an input of points. To see if what I was given worked, I wanted to run the line segments through my voxel visualizer, but first needed to represent the data in a voxelized way. This meant I needed to draw the lines using voxels, which only previous drew points as pixels. So, I added Bresenham’s Line drawing algorithm to the code and produced the following results.
Voronoi Diagram Comparison
Leaf Skeleton X-Ray

Voronoi Diagram

Bresenham’s Line drawing algorithm
x = x1; y = y1;
dx = x2 - x1; dy = y2 - y1;

if(abs(dx)>abs(dy))
	step = abs(dx);
else
	step = abs(dy);

xinc = dx / step;
yinc = dy / step;

for(k=1;k<=step;k++)
{
	x = x + xinc;
	y = y + yinc;
	if( x < 0 || x > 1000 || y < 0 || y > 1000)
		return;
	addPixel((int)x, 0.0, (int)y);
}
Voronoi Diagram Visualizer: Demo